 Skip to content
Human General Phenotyping (26-Color) Flow Cytometry Panel
Unlock deep immune insights with a pre-optimized 26-color phenotyping panel for human PBMCs. Profile T cells, B cells, NK cells, dendritic cells, monocytes, and ILCs in one powerful, ready-to-use workflow.
Human General Phenotyping 26c
Cell populations and gating definitions.
| Population | Gating Definition |
|---|---|
| Basophils | CD45+CD123+HLA-DR-CD11c- |
| Monocytes | |
| Classical Monocytes | CD45+SSCHiCD14+CD16- |
| Intermediate Monocytes | CD45+SSCHiCD14+CD16+ |
| Non-Classical Monocytes | CD45+SSCHiCD14-CD16+ |
| Lymphocytes | |
| Lymphocytes | CD45+SSClo |
| ILCs | CD45+(Lin-)CD3-TCRγδ-CD19-CD20-CD14-CD123-CD16-HLA-DR-CD4-CD8-CD127+ |
| Dendritic Cells | |
| pDCs | CD45+CD3-TCRγδ-CD19-CD56-CD14-HLA-DR+CD123+CD11c- |
| DCs | CD45+CD3-TCRγδ-CD19-CD56-CD14-HLA-DR+CD123-CD11c+CD16+ |
| CD141+ DC | CD45+CD3-TCRγδ-CD19-CD56-CD14-HLA-DR+CD123-CD11c+CD16-CD141+ |
| CD1c+ DC | CD45+CD3-TCRγδ-CD19-CD56-CD14-HLA-DR+CD123-CD11c+CD16-CD141-CD1c+ |
| B Cells | |
| Naïve B Cell | CD45+CD3-TCRγδ-CD19+CD20+IgD+CD27- |
| Memory B Cells | CD45+CD3-TCRγδ-CD19+CD20+IgD+CD27+ |
| Memory B Cells Class Switched | CD45+CD3-TCRγδ-CD19+CD20+IgD-CD27+ |
| Plasmablast | CD45+CD3-TCRγδ-CD19+CD20+CD27+CD38HI |
| NK / NKT | |
| High Cytotoxic NK cells | CD45+CD3-TCRγδ-HLA-Dr- CD56dimCD16+ |
| Cytokine producing NK cells | CD45+CD3-TCRγδ-HLA-Dr- CD56brightCD16lo |
| NKT cells | CD45+CD3-TCRγδ-CD56+ |
| T Cells | |
| Gamma Delta T cells | CD45+CD3+TCRγδ+CCR7 vs CD45RA |
| Helper T Cells (CD4) | |
| Helper T Cells | CD45+CD3+TCRγδ-CD4+CD8- |
| Naïve CD4+ Helper T cells | CD45+CD3+TCRγδ-CD4+CD8-CCR7+CD45RA+ |
| Central Memory CD4+ Helper T cells | CD45+CD3+TCRγδ-CD4+CD8-CCR7+CD45RA- |
| Effector CD4+ Helper T cells | CD45+CD3+TCRγδ-CD4+CD8-CCR7-CD45RA- |
| Effector Memory CD4+ Helper T cells | CD45+CD3+TCRγδ-CD4+CD8-CCR7-CD45RA-CD28vxCD27 |
| Regulatory T cells (Tregs) | CD45+CD3+TCRγδ-CD4+CD8-CD127-CD25+CCR7 vs CD45RA |
| Cytotoxic T Lymphocytes (CD8) | |
| Cytotoxic T Lymphocytes | CD45+CD3+TCRγδ-CD4-CD8+ |
| Naïve Cytotoxic T cells | CD45+CD3+TCRγδ-CD4-CD8+CCR7+CD45RA+ |
| Central Memory Cytotoxic T cells | CD45+CD3+TCRγδ-CD4-CD8+CCR7+CD45RA- |
| Effector CTL | CD45+CD3+TCRγδ-CD4-CD8+CCR7-CD45RA- |
| Effector Memory CTL (TEMRA) | CD45+CD3+TCRγδ-CD4-CD8+CCR7-CD45RA+ |

The Human General Phenotyping (26-Color) Panel is a high-parameter, pre-optimized flow cytometry panel designed to deeply characterize major immune cell subsets in human peripheral blood mononuclear cells (PBMCs). It enables robust identification of innate and adaptive immune populations in a single staining tube, reducing the time and effort required for complex panel design
Key Features & Benefits
Efficiency
26-color, pre-optimized configuration reduces panel development time.
Broad Immune Coverage
T cells, B cells, NK cells, monocytes, dendritic cells, ILCs, basophils.
Optimization
Optimized antibody–fluorochrome pairing minimizes spectral overlap.
Superior Gating
Validated for human PBMCs with clean, reproducible gating.
Workflow
Streamlined workflows allow researchers to focus on data interpretation.
Target Immune Cell Populations
The panel resolves major immune lineages including T cells (CD4+, CD8+, memory, Tregs), B cell subsets (naïve, memory, plasmablasts), NK cell subsets (CD56bright/dim), ILC populations, monocyte subsets, dendritic cells, and basophils.
Featured Case Studies / Capabilities
T and NK cells
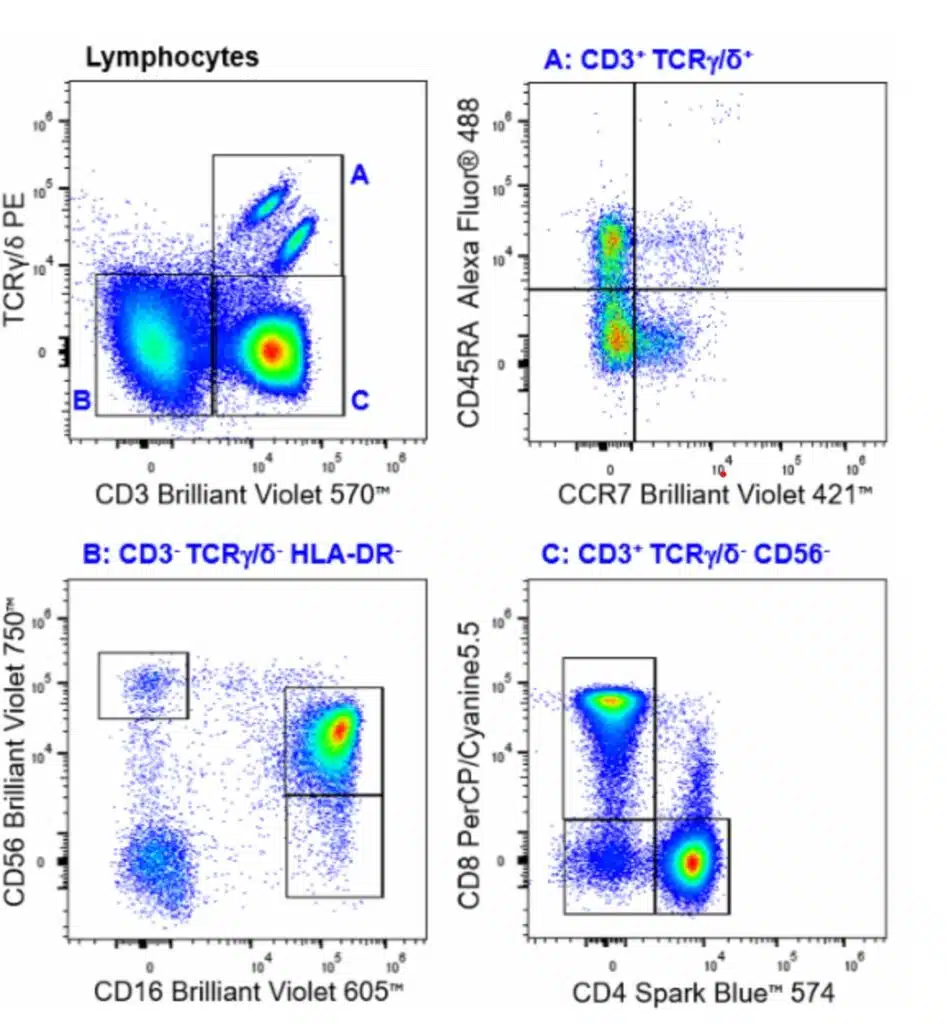
Human peripheral blood mononuclear cells were stained with the Human General Phenotyping (26c) panel. γ/δ T cells are depicted as TCRγ/δ+ CD3+ cells (A, top right). Multiple NK populations were identified as CD3- TCRγ/δ+ HLA-DR- triple-negative cells (B, bottom left). α/β T cells, defined as CD3+ TCRγ/δ- CD56- cells, are further divided into CD4+ and CD8+ T cell populations (C, bottom right). All data were gated on CD45+ viable single cells within the lymphocyte population.
CD4+ and CD8+ T cells
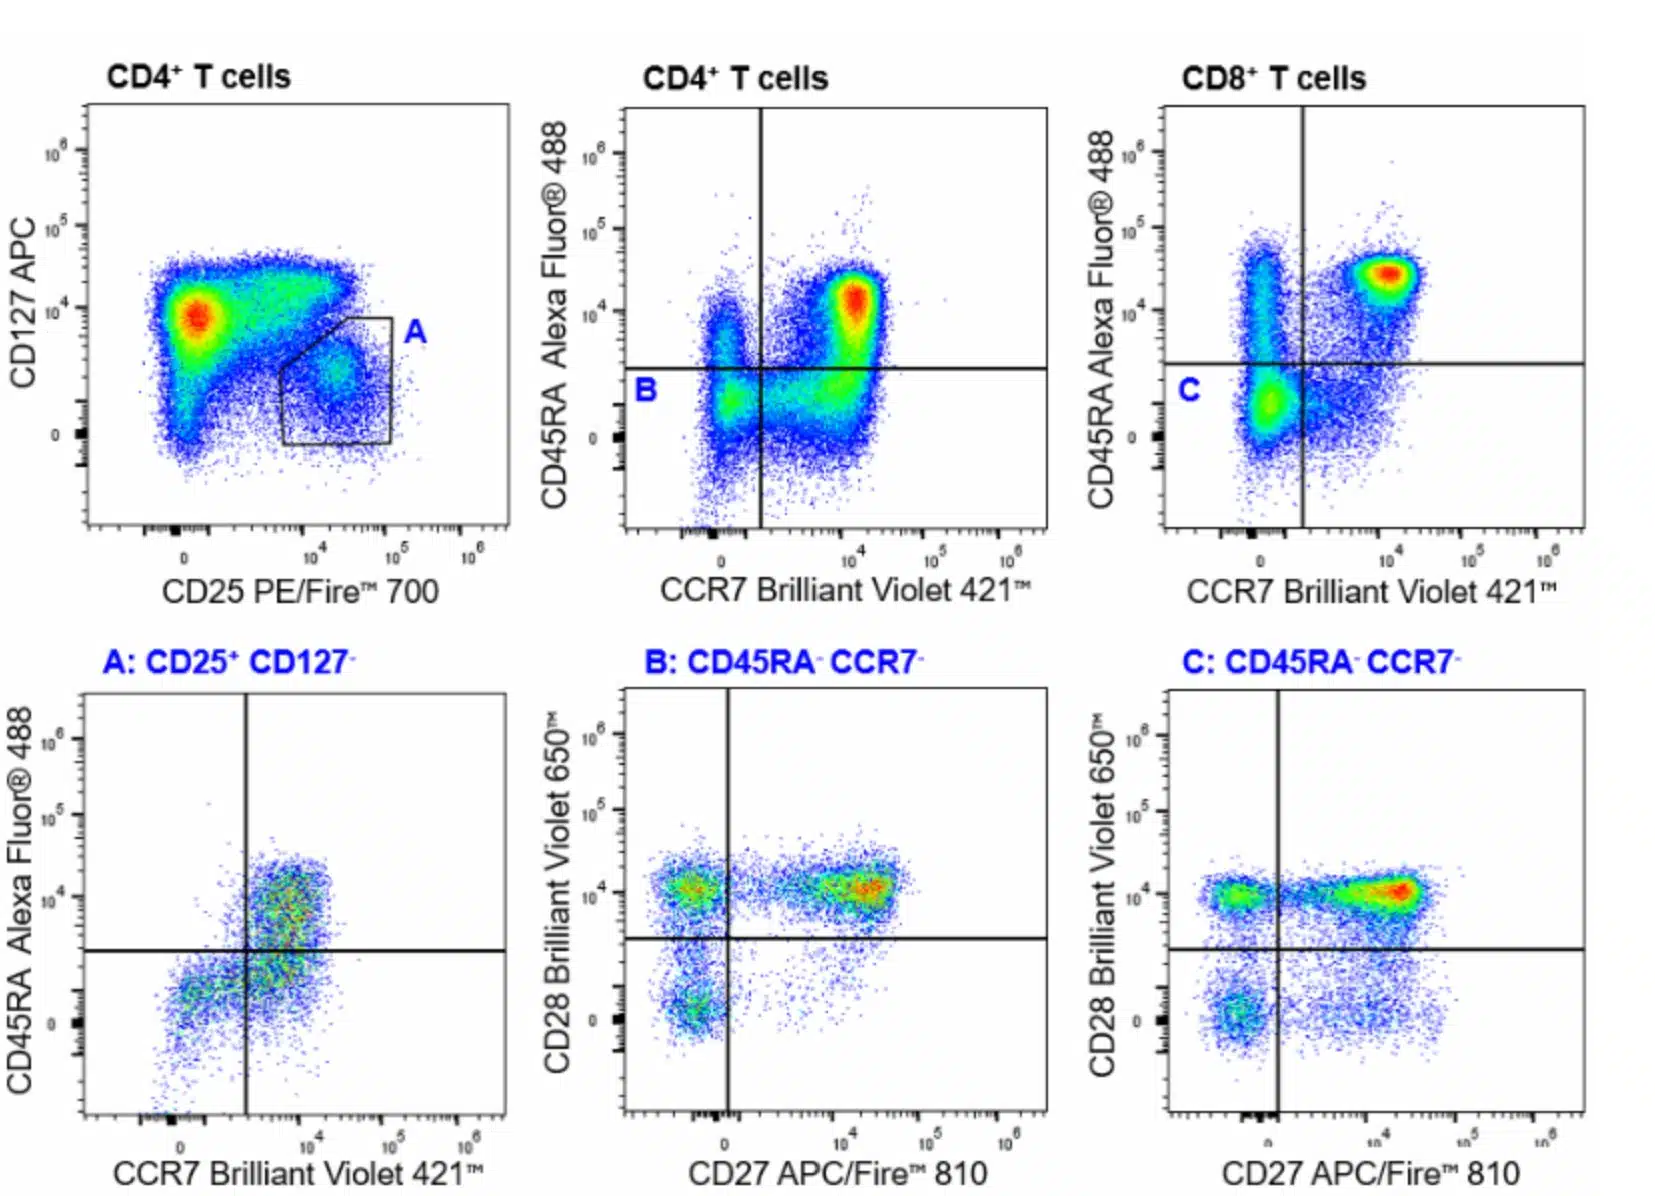
Human peripheral blood mononuclear cells were stained with the Human General Phenotyping (26c) panel. CD4+ T cell subsets, including CD25+ CD127- Tregs (A, bottom left) and CD45RA- CCR7- effector memory T cells (TEM) (B, bottom middle) are shown. CD8+ T cell subsets, including CD45RA- CCR7- effector memory T cells (TEM) (C, bottom right) are also shown. All data were gated on CD45+ CD3+ TCRγ/δ- CD56- viable single cells within the lymphocyte population.
B Cells
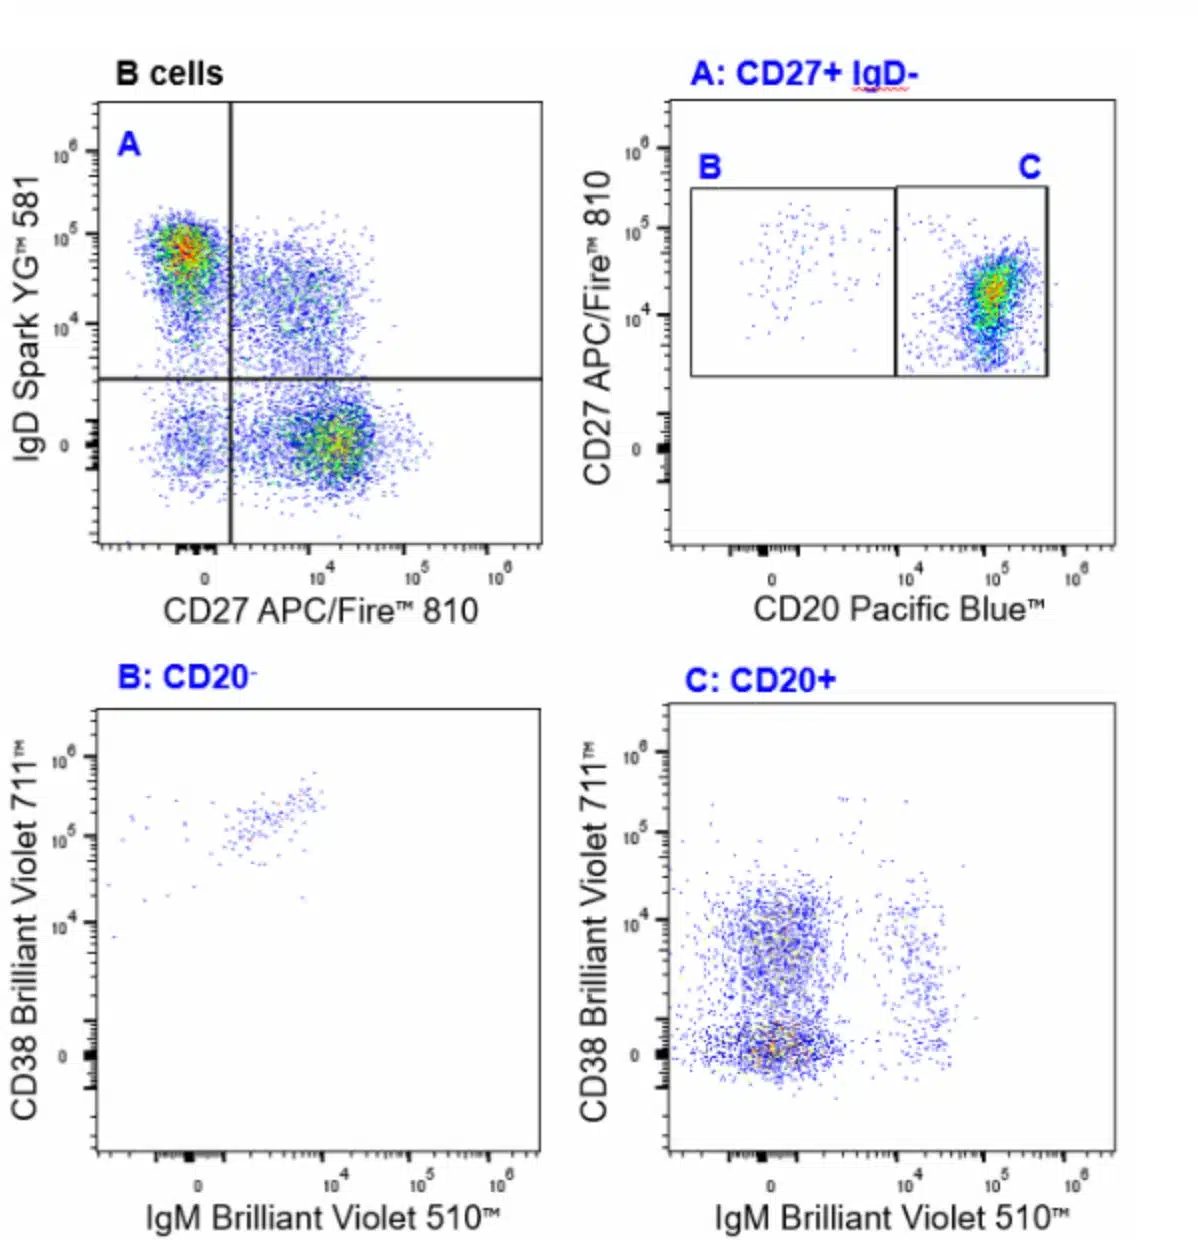
Human peripheral blood mononuclear cells were stained with the Human General Phenotyping (26c) panel. CD27+ IgD- memory B cells (A, top right) were further distinguished as CD20- plasmablasts (B, bottom left) and CD20- memory B cells (C, bottom right). All data were gated on CD45+ CD19+ CD3- TCRγ/δ- viable single cells within the lymphocyte population.
Dendritic cells and monocytes
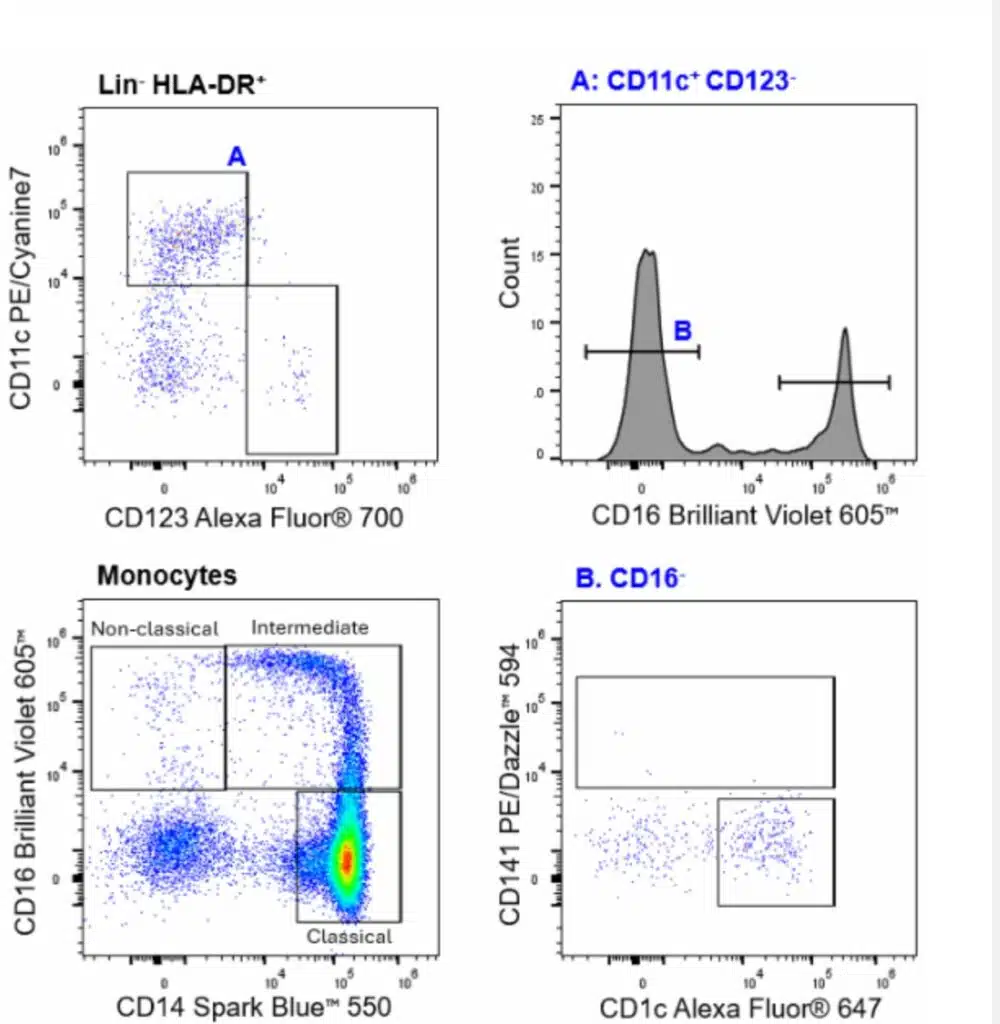
Human peripheral blood mononuclear cells were stained with the Human General Phenotyping (26c) panel. Dendritic cells (DCs) were identified as CD45+ HLA-DR+ TCRγ/δ- CD3- CD56- CD19-- cells in the lymphocyte gate (top left). Classical DC subsets are further analyzed (top right and bottom right). Non-classical (CD14-CD16+), intermediate (CD14⁺CD16⁺), and classical (CD14+CD16-) monocytes are shown as viable CD45+ single cells within the monocyte population (bottom left).
Basophils
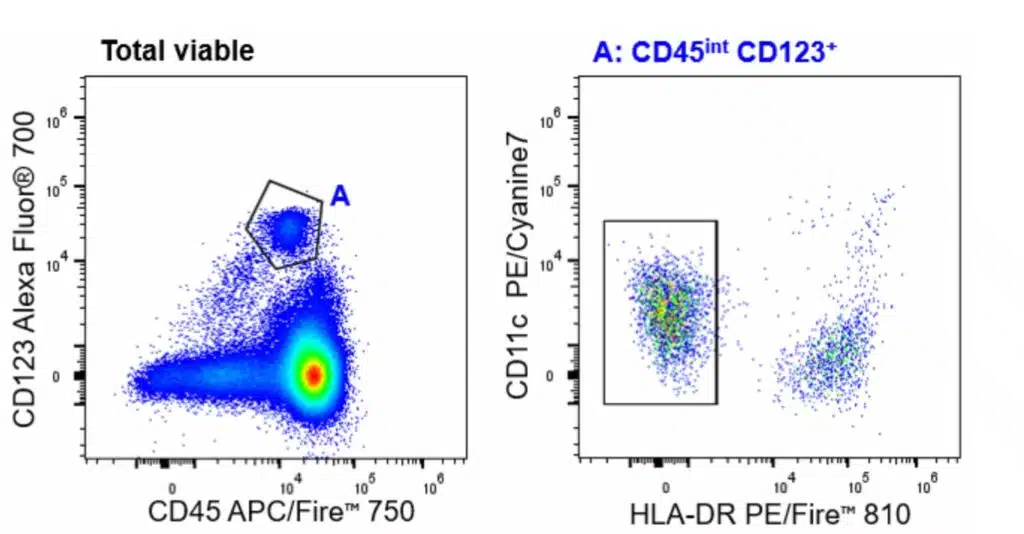
Human peripheral blood mononuclear cells were stained with the Human General Phenotyping (26c) panel. CD45int CD123+ basophils (A) were gated on total viable single cells.
Innate Lymphoid Cells
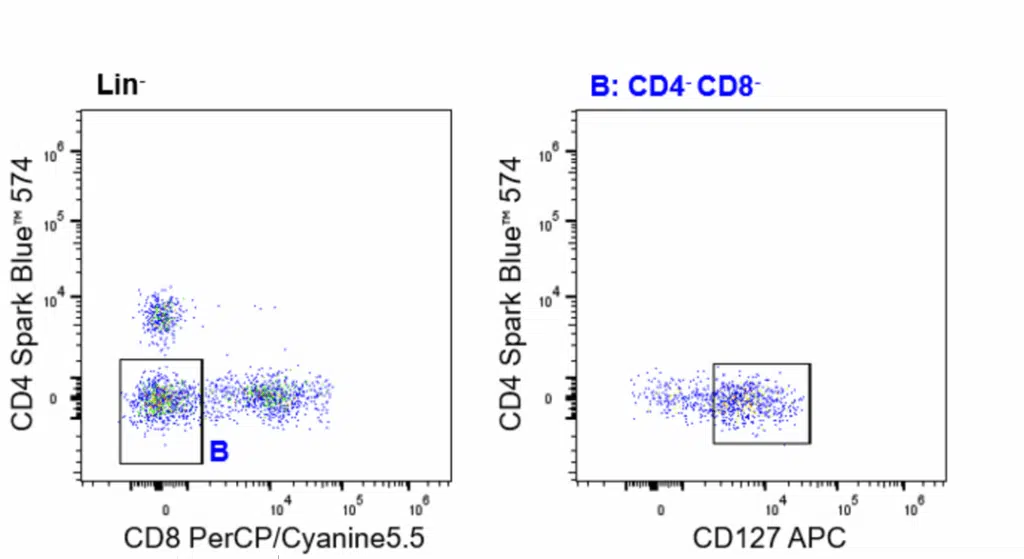
Human peripheral blood mononuclear cells were stained with the Human General Phenotyping (26c) panel. Data shown are gated on CD45+ CD3- TCRγ/δ- CD19- CD20- CD14- CD123- CD16- HLA-DR- cells in the lymphocyte population.
Recommended Application
The Human General Phenotyping (26-Color) Panel is designed for researchers who are in search of a comprehensive method for understanding the immune system. With a single staining tube, researchers can capture the full picture of innate and adaptive immunity, making this panel an ideal solution for your next program.
In immuno-oncology, the panel helps teams quickly identify key changes in T cells, NK cells, monocytes, and dendritic cells—critical indicators of how patients are responding to checkpoint inhibitors, CAR-T therapies, or other immune-modulating treatments. With clear resolution of activation and memory states, researchers gain actionable insights that support biomarker discovery and patient-stratification strategies.
In autoimmune and inflammatory disorders, the panel delivers a balanced look at dysregulated immune pathways by simultaneously measuring T, B, and innate subsets. This makes it easier to pinpoint abnormal immune patterns, understand disease mechanisms, or assess patient responses to therapies such as biologics or targeted immune modulators.
The panel also excels in immune reconstitution monitoring following transplantation, stem-cell therapy, or cytotoxic treatments. It provides a clear understanding of how the immune system rebuilds—tracking the return of naïve and memory T cells, the re-establishment of B cell populations, and the normalization of innate cell numbers. These insights help researchers spot delayed or atypical recovery early and adjust care strategies accordingly.
Finally, the panel is ideal for large-scale cohort studies and baseline immune profiling. Because it covers so many immune subsets at once, it offers a streamlined way to compare immune signatures across populations, identify trends, and build immune reference maps for systems-level research.