 Skip to content
Inducing Geographic Atrophy in Mouse Models Using an 810nm Laser
Ichor has validated the use of an 810nm laser with optimized wavelength lens for creating a reproducible mouse model for inducing geographic atrophy (GA). Utilize our expertise in dry AMD and GA preclinical studies to advance your investigational products and research programs.
")
For inducing geographic atrophy (GA) in mouse models, we use a fiber-coupled continuous wave 810nm diode laser equipped with a wavelength-optimized lens, connected to a MICRON Image-Guided Laser attachment. The near-infrared laser allows for deeper penetration for absorption by the retinal pigment epithelium (RPE) and choroid.
Improved laser targeting
810nm wavelength allows for selective targeting of RPE cells. This results in a reduction in collateral tissue damage when compared to other laser models.
Layer-specific analysis
High‑resolution OCT quantifies retinal thickness and structural changes from RNFL to RPE over 8 weeks.
Longitudinal lesion tracking
Utilizes fundus imaging to document lesion formation and progression at baseline, 2, 4, and 8 weeks.
Histological confirmation
H&E stained samples confirm lesion depth and RPE regression, correlating with OCT across power output.
Featured Model – Geographic Atrophy

The GA mouse model uses a fiber‑coupled continuous‑wave 810nm diode laser with a wavelength‑optimized lens connected to the MICRON Image‑Guided Laser. Lesion severity is controlled by power output (22/32/42 mW). The 22 mW setting produces GA‑like RPE and photoreceptor loss with inner nuclear layer proximity to Bruch’s membrane, ideal for preclinical therapy evaluation.
Endpoints

Total Mean Retinal Thickness of the Affected Laser Area
Represents mean total retinal thickness post-laser treatment with a radial distance of 1mm from the center of the GA.

Percent Change in Mean Total Retinal Thickness of the Affected Laser Area
Represents mean percentage change in thickness. Retinal layers were measured from the top of the RNFL through to the basement of RPE.
Featured Case Studies
Optical Coherence Tomography Results
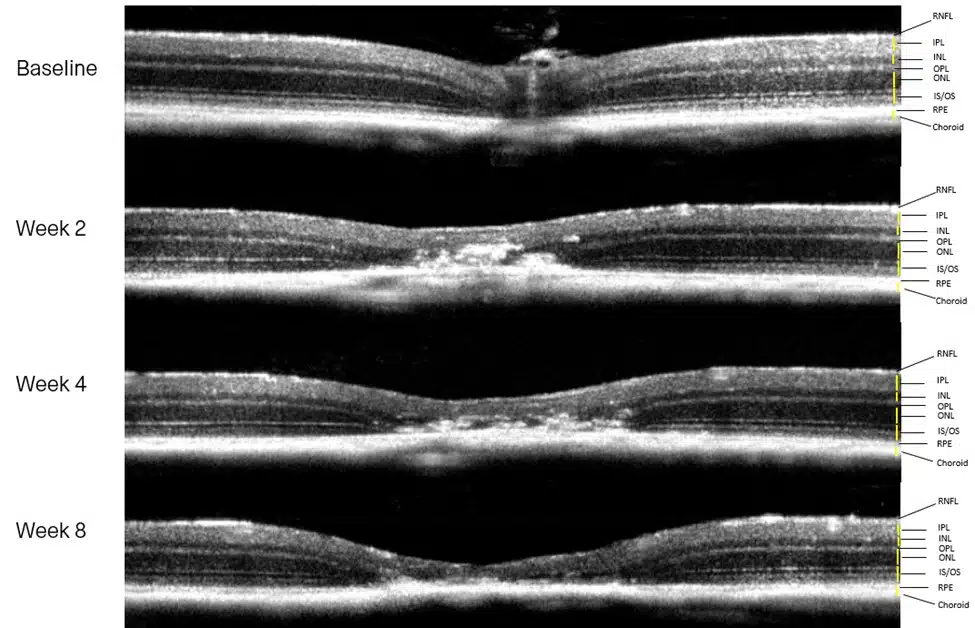
From OCT scans, the damage from 22 mW output presented most like clinical GA with damage causing the INL to be proximal to BrM, while 32 mW and 42 mW caused more severe full thickness atrophic lesions with damage present into the inner plexiform layer (IPL) seen in Group 2 32 mW exposure, and into the retinal nerve fiber layer (RNFL) seen in Group 342 mW exposure.
Color Fundus Photography
 Representative Color Fundus Photography showing the formation of lesions immediately following laser treatment and the following 8 weeks for 3 levels of laser intensity.
Histological Changes

Histopathology using H&E staining corroborates the OCT data showing similar effects confirming that after 8 weeks post-laser induction Group 1, 22 mW shows similar pathology to GA with damage into the inner nuclear whereas Group 2, 32 mW caused severe damage into the IPL, and Group 3, 42 mW causing severe damage into the RNFL.