 Skip to content
nanoDSF Assay Services
nano-Differential Scanning Fluorimetry (nanoDSF) is a biophysical characterization technique used to assess the conformational stability of a biological sample, typically a protein.
Samples are subjected to either temperature ramps or gradients of chemical denaturant, and the intrinsic fluorescence is measured and fit to determine the melting points (Tm).

NanoDSF is a type of Differential Scanning Fluorimetry used to determine conformational protein stability by employing intrinsic tryptophan or tyrosine fluorescence, as opposed to the use of extrinsic fluorogenic dyes that can perturb the system and affect protein stability.
We exclusively use the SUPR-DSF spectrometer from Protein Stable for our DSF measurements.
Reliably measure protein Tm values
The SUPR-DSF instrument measures protein conformational stability via thermal denaturation (10 oC - 105 oC) or chemical denaturation (chaotropes).
Label-Free
nanoDSF utilizes intrinsic protein fluorescence, meaning there’s no need for adding dyes.
Native Sample Measurement
Samples can be analyzed as-is without dilution, rebuffering, or the addition of exogenous fluorophores.
Minuscule Sample Requirements
10 µL of sample is all that’s needed. Sample concentrations as low as 0.1 mg/mL.
Full Spectrum Data
Fluorescence data is recorded from 310nm-420nm for every sample, enabling global data fitting.
High-Throughput
Measure 384 samples or replicates per experiment. We pass the value and cost savings onto you.
What sets Ichor’s nanoDSF services apart?
Ichor’s nanoDSF services include sample handling, standard assay execution, data analysis & reporting, and development of custom workflows for unique projects.
Small Molecule Binding Studies

Ichor’s nanoDSF services go beyond routine formulation screening experiments and into the realm of small molecule binding studies. Traditional DSF assays are very limited in their tolerance of small molecules due to the constraint of only measuring two emission intensities at 330 nm and 350 nm. If a small molecule has an autofluorescent contribution to these two filter sets, an accurate shift in the Tm will not be measurable. The SUPR-DSF uses a CMOS fluorimeter which gives us emission intensity between 310 nm and 420 nm, making it possible to choose a range that is free of interference.
Data Analysis with the SUPR-DSF


Barycentric Mean Fluorescence Analysis
Barycentric Mean: BCM measures the center of mass of the fluorescence waveform, enabling the computation of wavelength shifts as the protein unfolds. BCM produces better results than the ratio method by taking advantage of the entire fluorescence spectrum.

Melt Curve Analysis
The data that results from the BCM fluorescence analysis can be fit using either a thermodynamic model or by taking the 1st Derivative and calculating the inflection points.
Featured Capabilities / Case Studies – Courtesy of Protein Stable
Formulation Ranking – Case Study 1
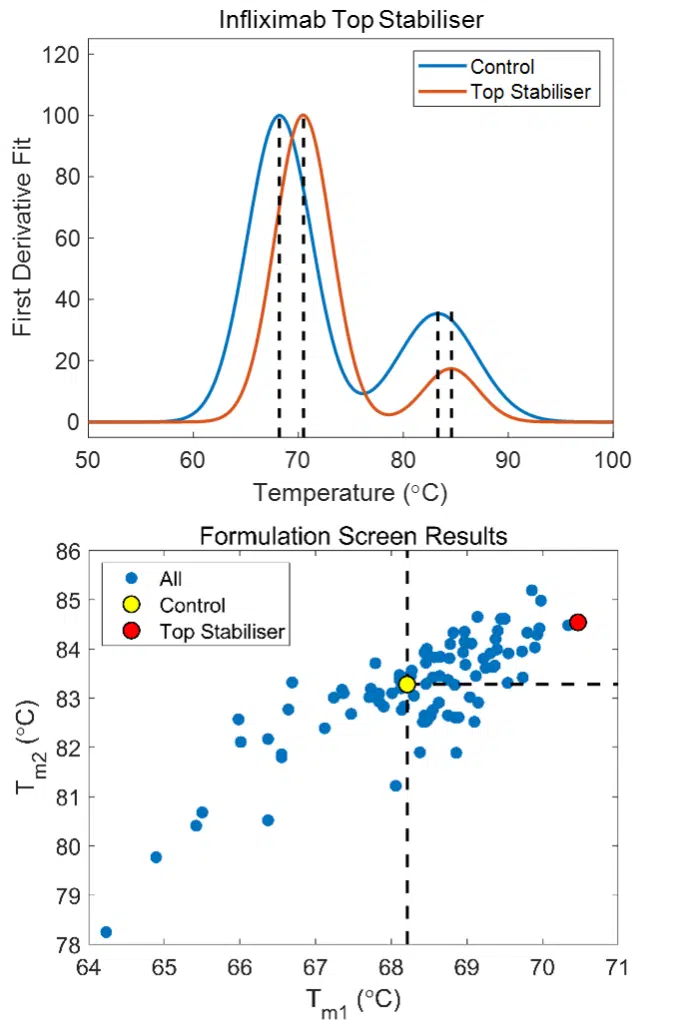
Finding Formulations Faster with the SUPR-DSF
- Screened mAb Infliximab and 96 formulations in triplicate in a single experiment using the FORMOscreen®
- 24 Formulations improved stability of the first transition by more than 1.0°C.
- Top stabilizer, shown as the red circle, improved the stability of both the first (2.3°C) and second transition (1.3°C).
- Methodology is readily adaptable to forced-degradation studies.
Formulation Ranking – Case Study 2
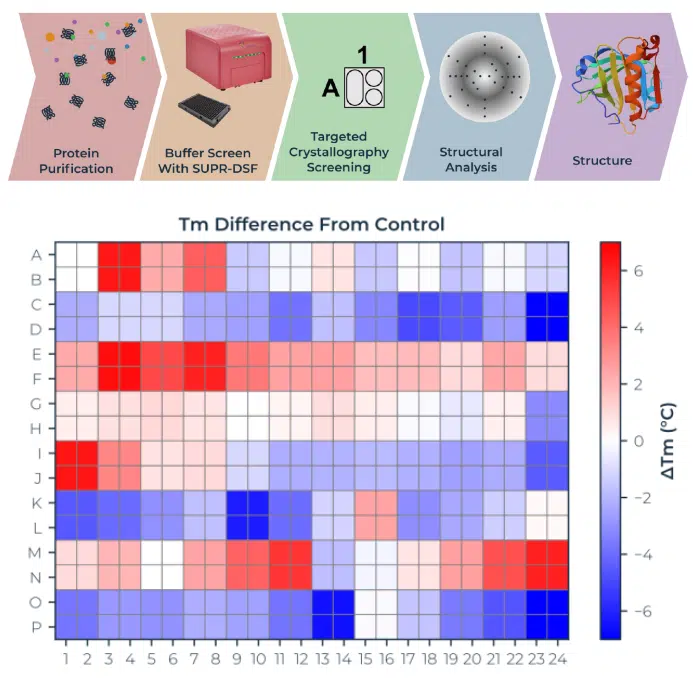
Targeting Optimal Buffers for Downstream Crystallization Screening
- The process of X-ray crystallography requires purified protein to form crystals in optimal buffer conditions on specialized crystallization plates.
- A primary buffer screen of larger global parameters (buffer system, pH, salt, concentration etc.) before this experimental step can greatly reduce the window of buffers to test and minimize consumable costs.
- The stability of proteins in initial buffer conditions has been directly linked with crystal formation success in subsequent crystallography screens.
- Thermal stability of Beta-Lactoglobulin was screened against a series of buffer formulations in RUBIC Buffer Screen.
- Optimal conditions were found to be formulations with high salt, low pH citric acid.
- nanoDSF can also provide other critical parameters such as Tonset & ΔH.
- Conclusion: A quick formulation buffer screen can help to narrow in on promising conditions for single crystal growth, saving weeks of time.
Protein Characterization & Engineering
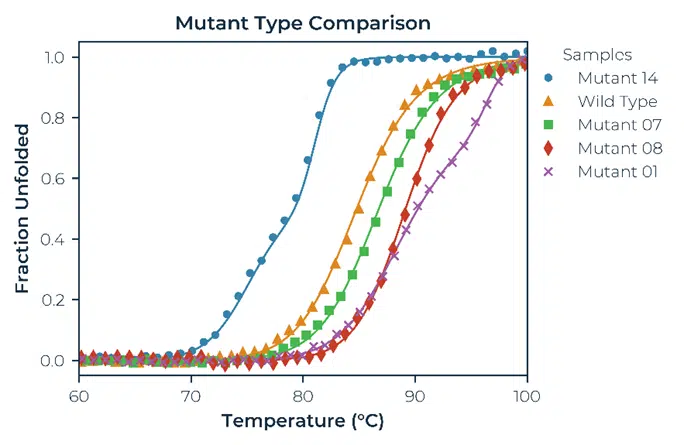
Speeding Up Early Stage Biotherapeutic Discovery with Next Generation nanoDSF
- Screened 15 mutants of parent protein (WT).
- Identified 8 mutants that improved stability by > 2°C better than WT – Mutants 01, 07 & 08.
Identification of AAV Serotypes and Characterization of Their Stability
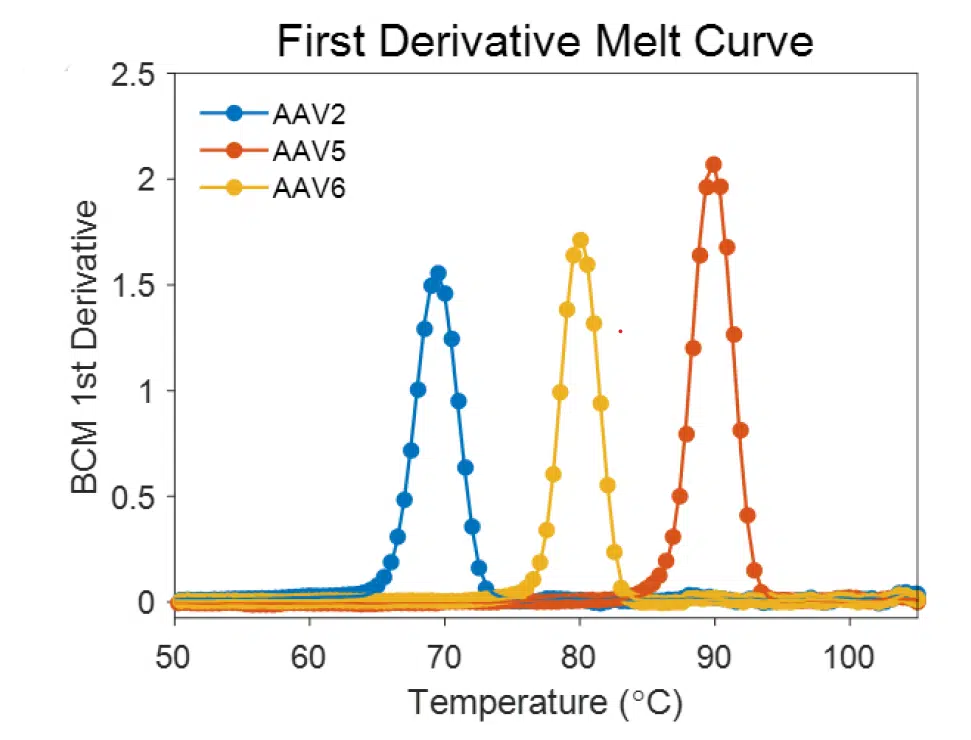
AAVs for Gene Therapy: Simultaneously Determine Component Serotypes and Optimize Stability
- AAVs have different amino acid sequences and capsid structures and therefore different Tm In this study, AAV2, AAV5, & AAV6 were compared.
- AAVs exhibit sharp melting points, allowing easy differentiation.
- nanoDSF makes formulation optimization easy.
- A low concentration of 2×10¹² VP/mL is sufficient to accurately measure AAV stability.
- KBI Biopharma (Louisville, CO) sourced all the AAVs, performed the sample preparation, and acquired data with the SUPR DSF.
Frequently Asked Questions
Learn more about Ichor’s nanoDSF services by reading below.
")